Know where the billable hours went: utilisation, billability and revenue per consultant, client and project, ready before you ask.
By the time someone assembles the figures, the month you could have fixed is already closed.
A company at 78% can be one consultant on 110% and another on 45%, and the average tells you neither.
Divide billable hours by a flat month and every consultant who took holiday or a public holiday shows up as underused.
A dashboard only helps if someone logs in on the right day, and in a busy week nobody does.
A billability dashboard for an IT consultancy that answers the questions you would otherwise ask your bookkeeper.
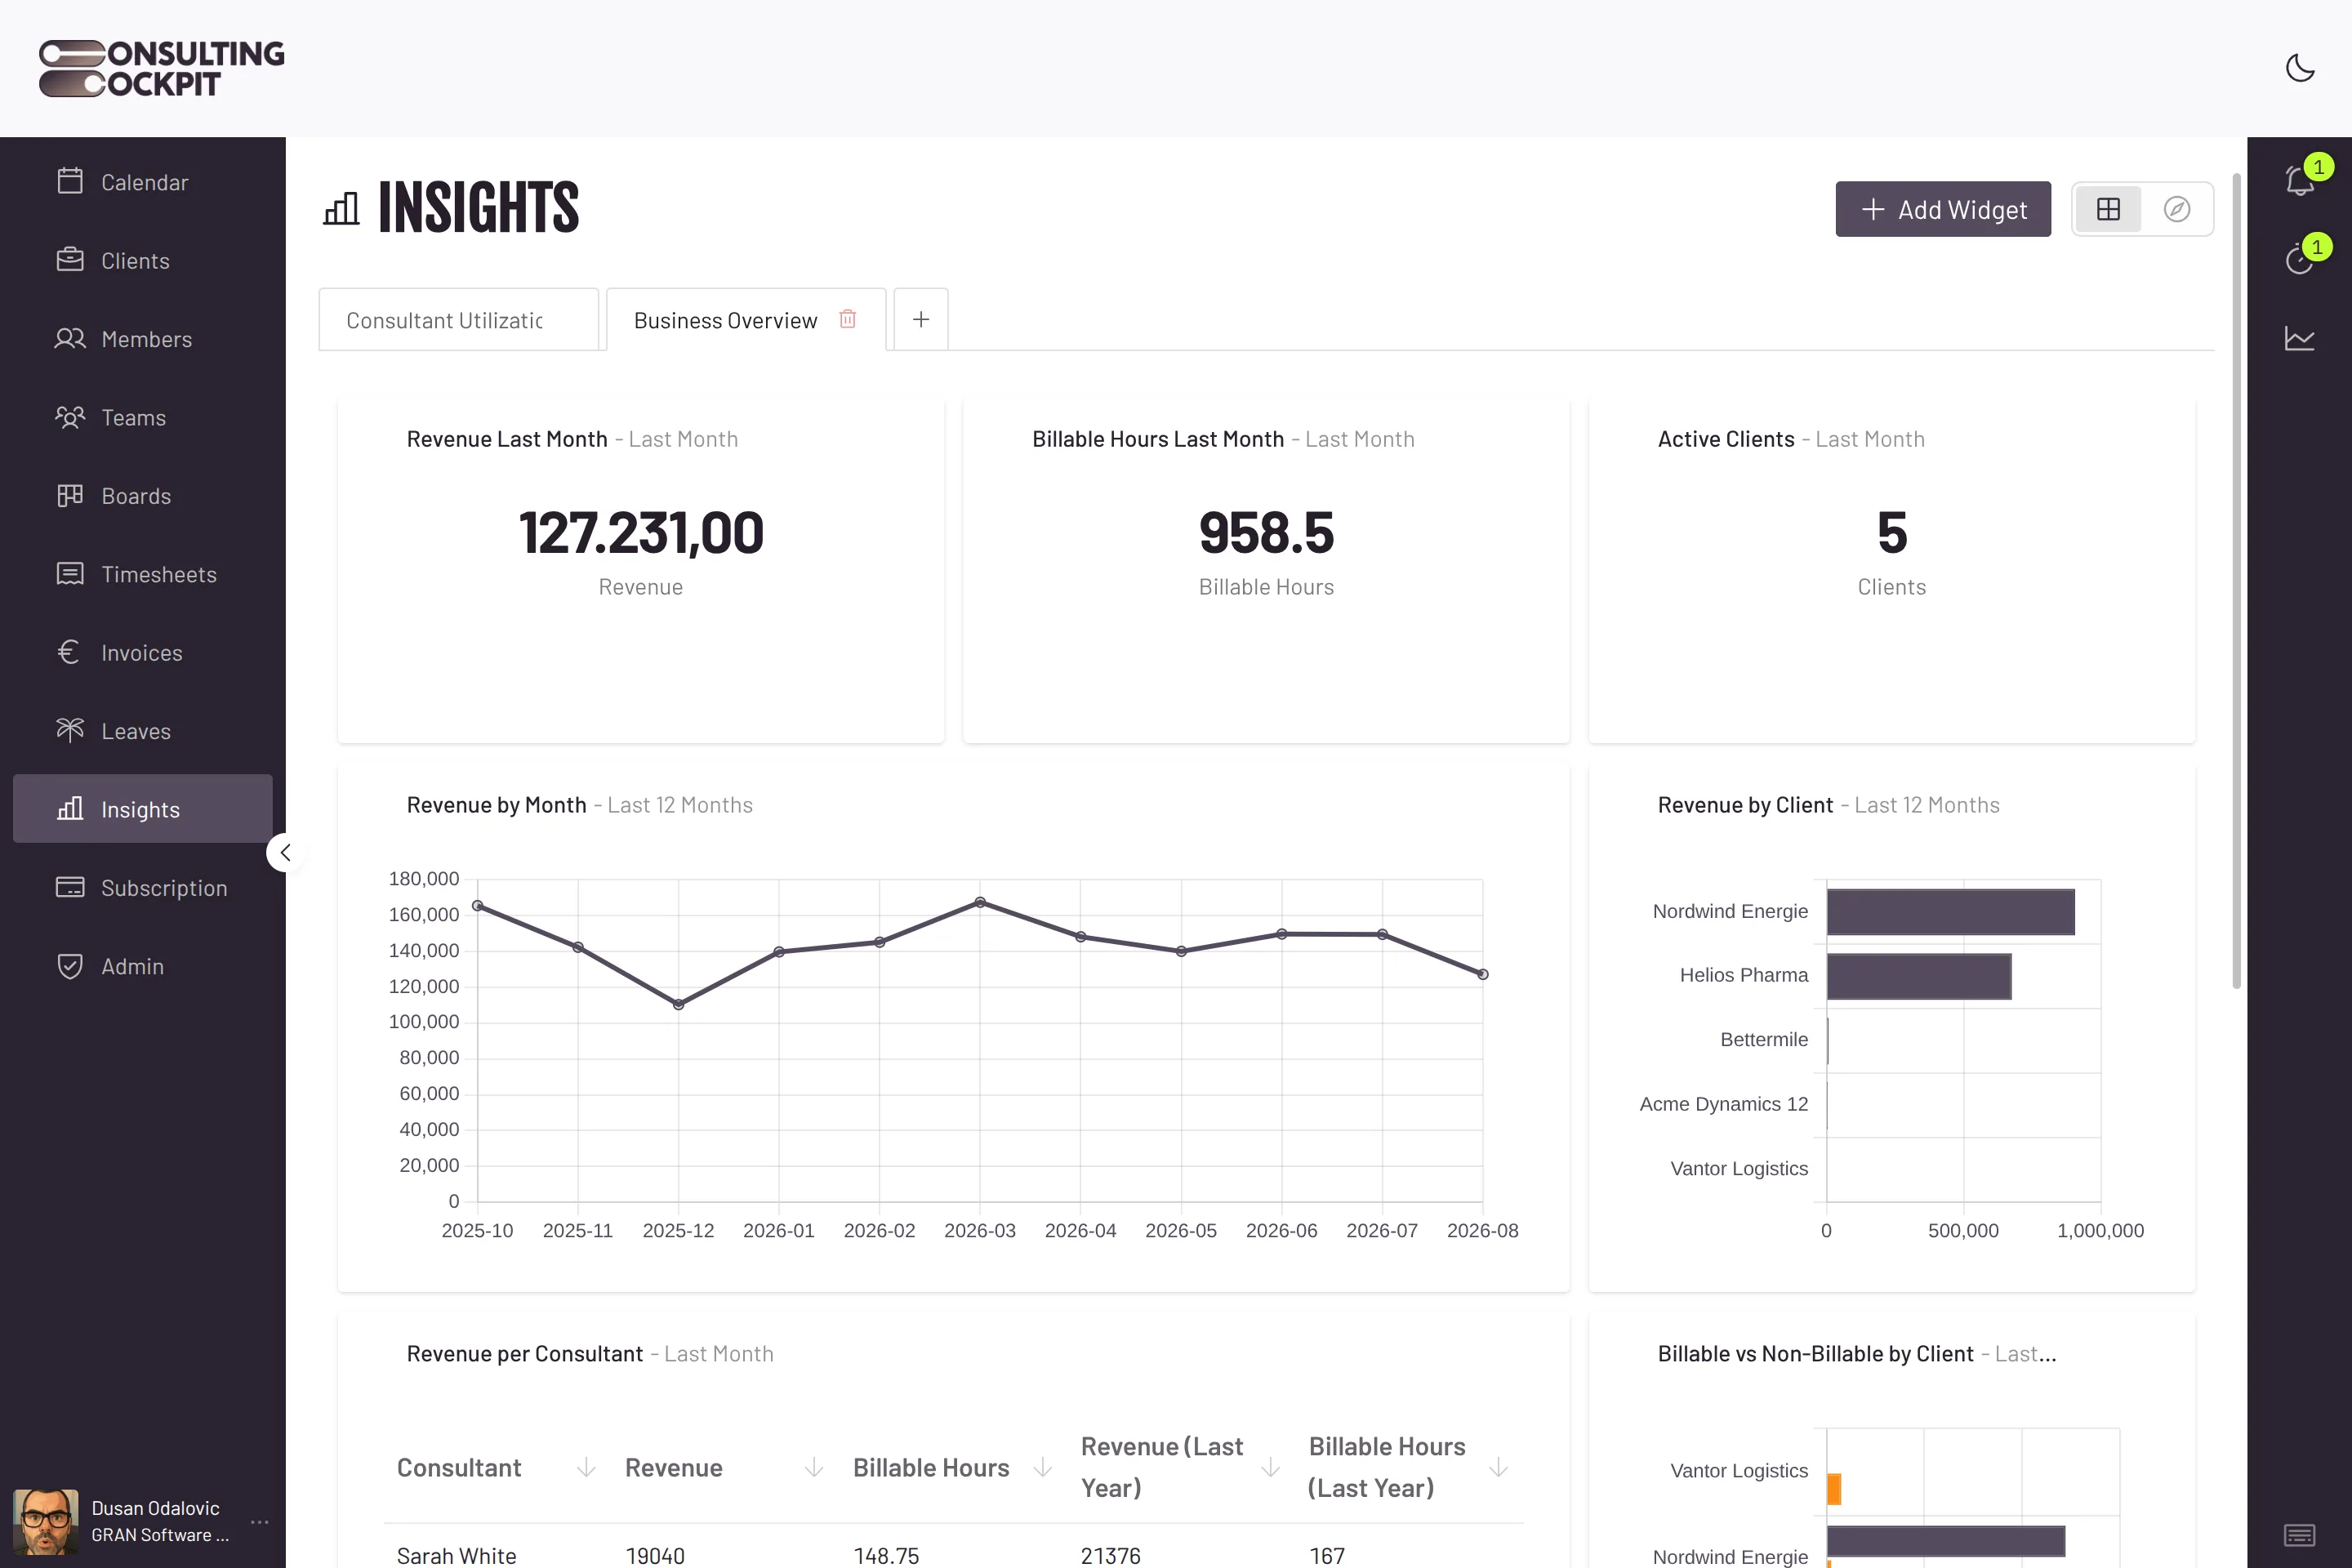
Up to three dashboards, each a grid you drag and resize: single-number tiles, trend lines, bar and horizontal bar charts, doughnuts and plain tables.
Pick daily hours or monthly figures, group by consultant, client, project or month, filter and sort, then save the answer as a tile on your dashboard.
Billable hours are measured against workable hours — weekdays minus the public holidays for that person's location, minus their approved leave — so a week of holiday no longer reads as poor performance.
Billable hours, utilisation and revenue can be shown beside the same month a year earlier, with the month-on-month change alongside.
Every Monday morning owners who switched it on get last week's Monday-to-Sunday hours per client, split into billable and non-billable.
Numbers a managing partner needs are not numbers every consultant should see.
A member opening the same tile sees their own hours and utilisation, never a colleague's.
Revenue and average hourly rate are owner-only figures, as is the company-wide view with average and median utilisation and headcount.
A widget you share is visible to your organisation and to nobody outside it, and you can unshare it at any time.
The company view counts how many consultants sat below 70% and how many went over 100%, month by month.
For the utilisation figure on its own, per consultant, per month, corrected for leave, and for last week's billable hours per client by email every Monday, see Utilisation Reporting , Weekly Billability Report and Scope Creep Prevention
Real screens from the product — swipe or use the arrows.
Billable, non-billable and total hours, utilisation and billability percentages, overtime, workable hours, days with and without entries, active clients, and revenue and average hourly rate for owners. You can group any of them by consultant, client, project, date or month.
Billable hours divided by workable hours. Workable hours are the weekdays in the period at eight hours, minus the public holidays of that consultant's location and minus their approved leave.
No. Members see only their own hours, and revenue, hourly rates and the company-wide view are reserved for owners.
Monday morning, covering the previous Monday to Sunday, with hours per client split into billable and non-billable. Owners switch it on under the billability report notification setting.
This week, last week, the last 7 or 30 days, this or last month, the last three or twelve months, this or last quarter, this or last year, or a date range you type in yourself.
Yes. Save it, mark it a favourite, or share it with your organisation so the rest of the team can drop the same tile onto their own dashboard.
Work out a consultant's utilization rate, billable revenue and the value of unbilled hours in a few seconds. Free, no sign-up.
Open the Billable Hours CalculatorSee billable and total utilization from available hours, and how many hours and euros separate a consultant from your target. Free, no sign-up.
Open the Utilization Rate CalculatorConnect your consultants' hours and read utilisation, billability and revenue per client on one screen. Free for 30 days.