See every consultant's utilization, billability and revenue each month — ready before you ask for them.

You know roughly who is busy, but not which consultants ran below 70% last quarter.
Dividing billable hours by a flat month punishes every consultant who took vacation.
Without prior-year figures, a 68% month looks acceptable until you see last year was 79%.
Every number exists in your time entries, but getting it out means someone crunches a spreadsheet.
Three things happen quietly in the background so your numbers are simply there each morning.
Every tracked hour lands in the day's total automatically. The monthly figures per consultant and for the whole company build on that.
Each consultant's available hours account for an 8-hour day, weekends, their local holidays and approved vacation — so time off never distorts the rate.
Utilization and billable percentage, overtime, available hours, untracked days, average hourly rate, and how many consultants sit below 70% or above 100%.
Prior-year and previous-month figures sit next to the current one, so a soft month is obvious at a glance.
Every figure respects who is allowed to see it.
Revenue and rate figures are visible to owners only — consultants never see them.
Every figure is computed for your organisation alone, on every request.
This month, last quarter, the last 12 months or a custom range — for both daily and monthly views.
Utilization is measured against the days people could actually work: approved leave and each location's public holidays are taken out first. Leave is handled by Days Off Management, and last week's billable hours per client arrive by email every Monday, see Days Off Management , Weekly Billability Report and Scope Creep Prevention
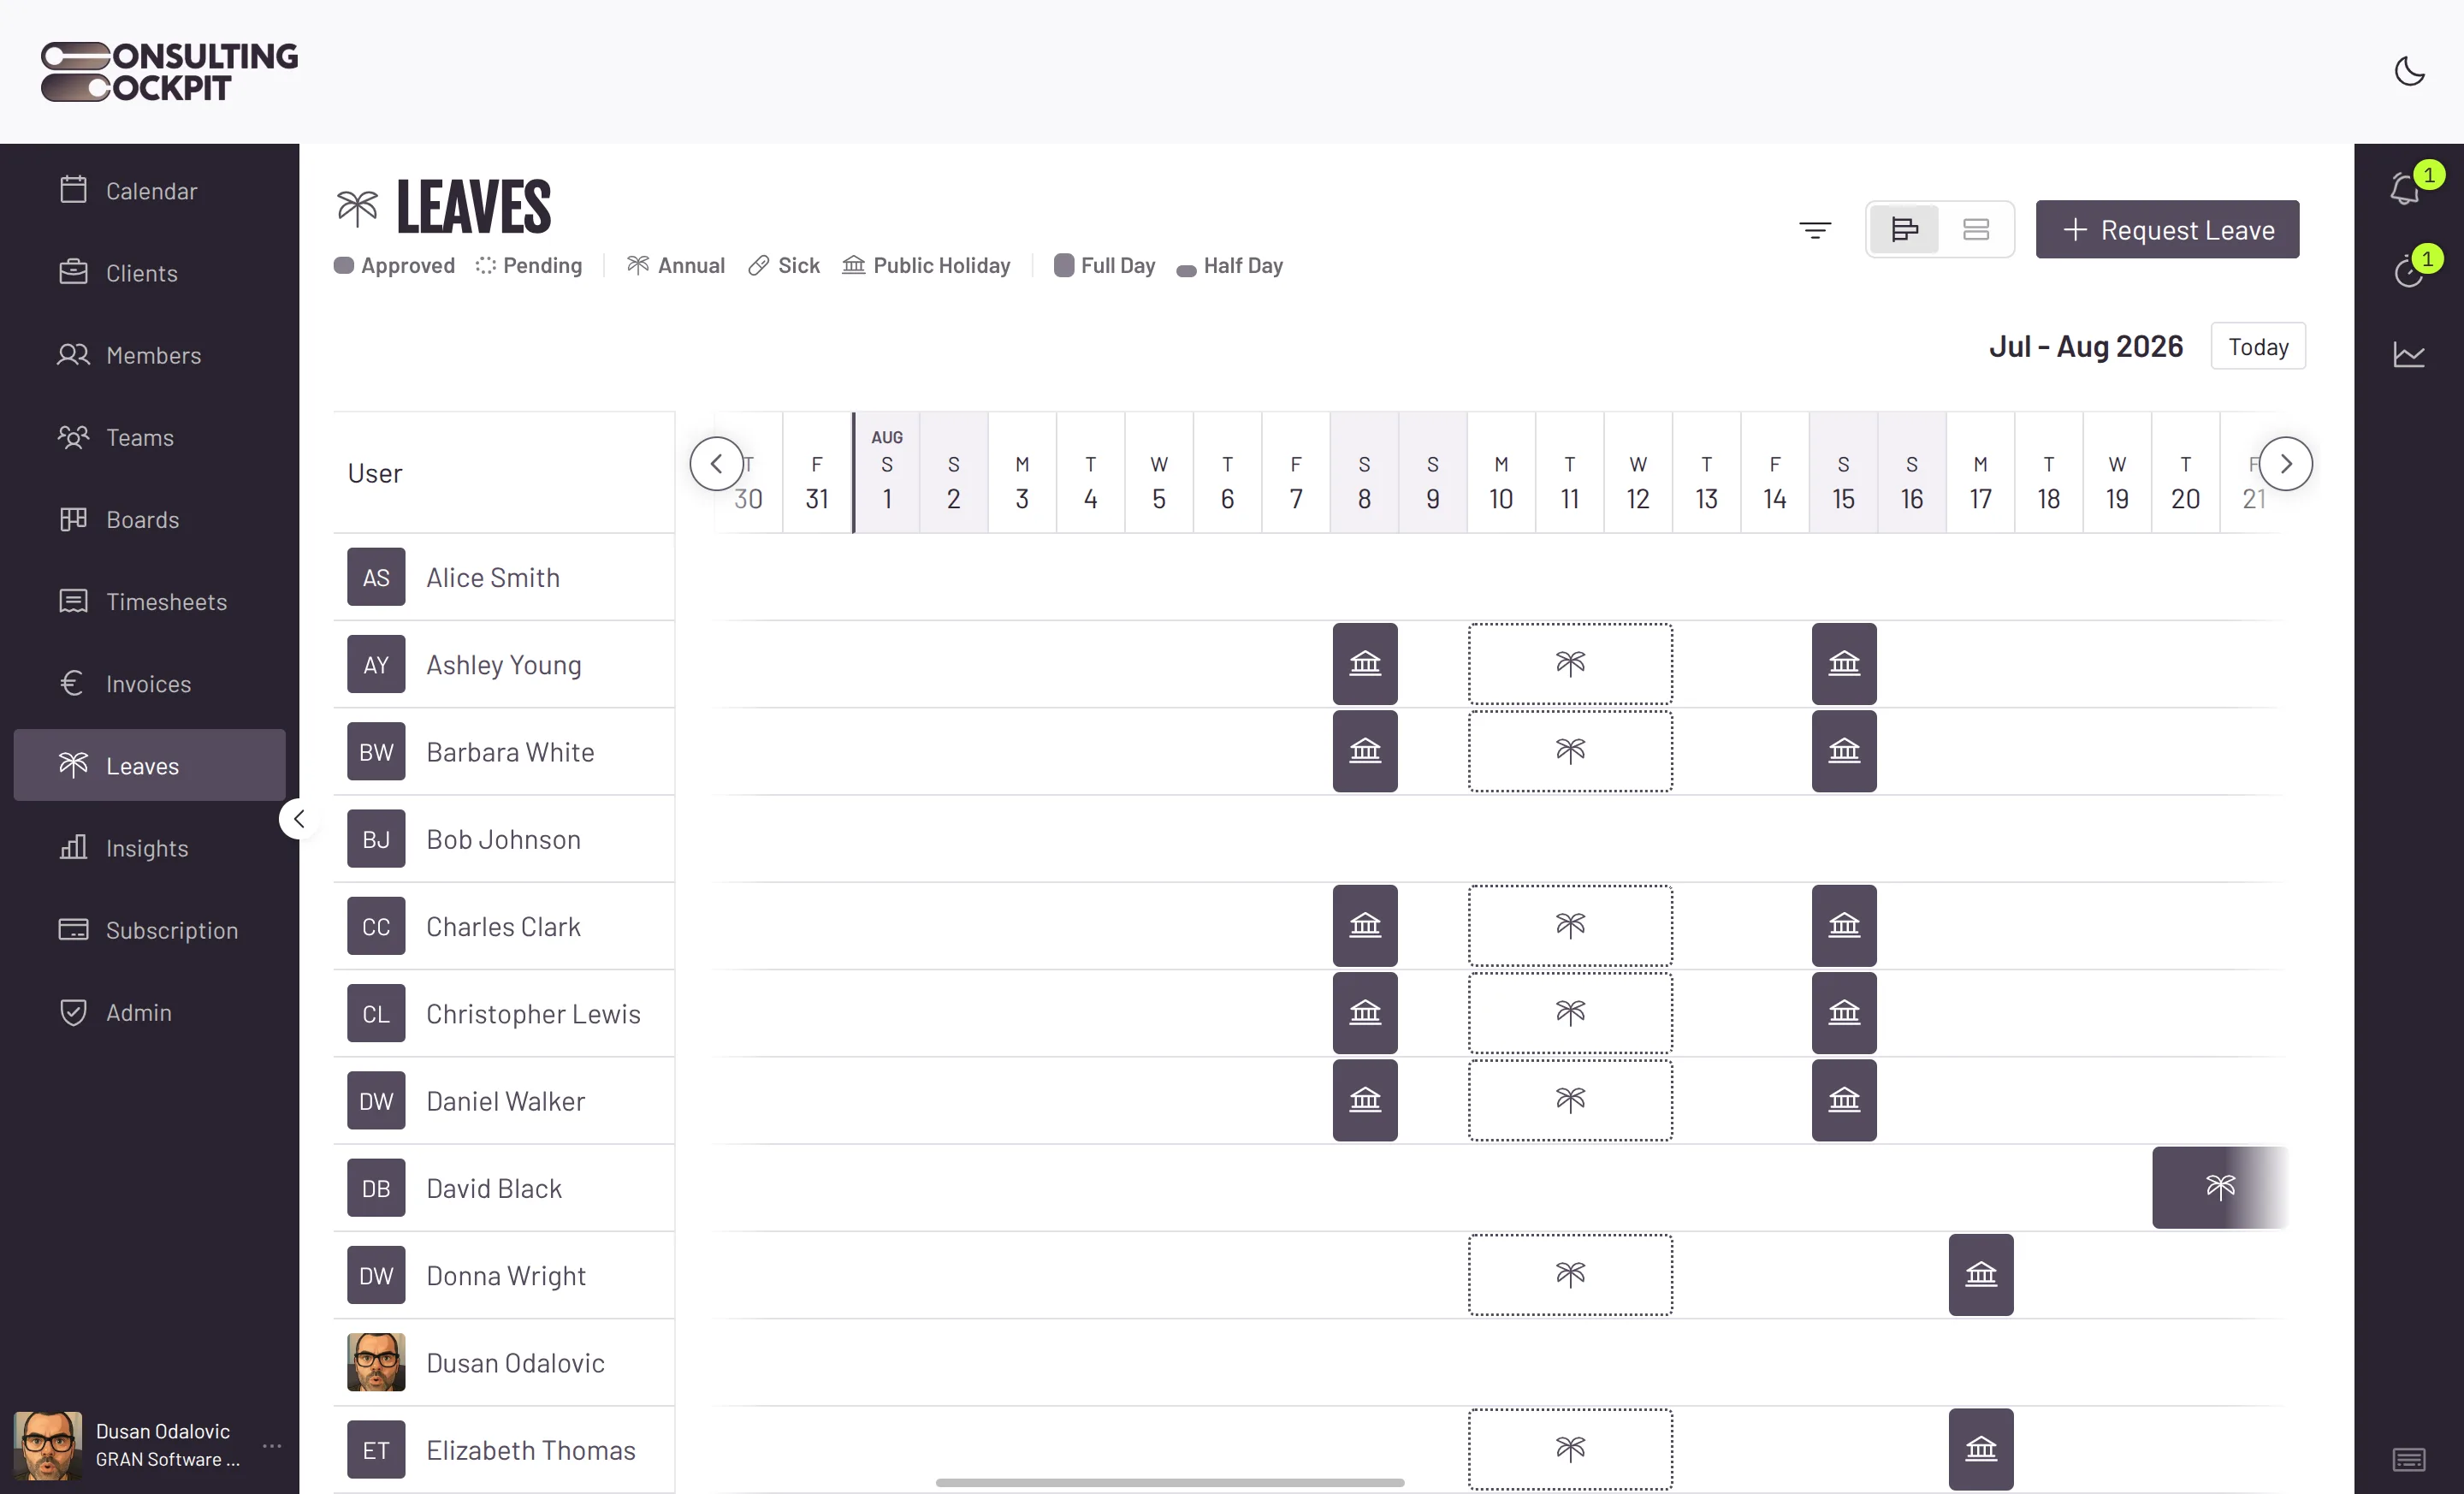
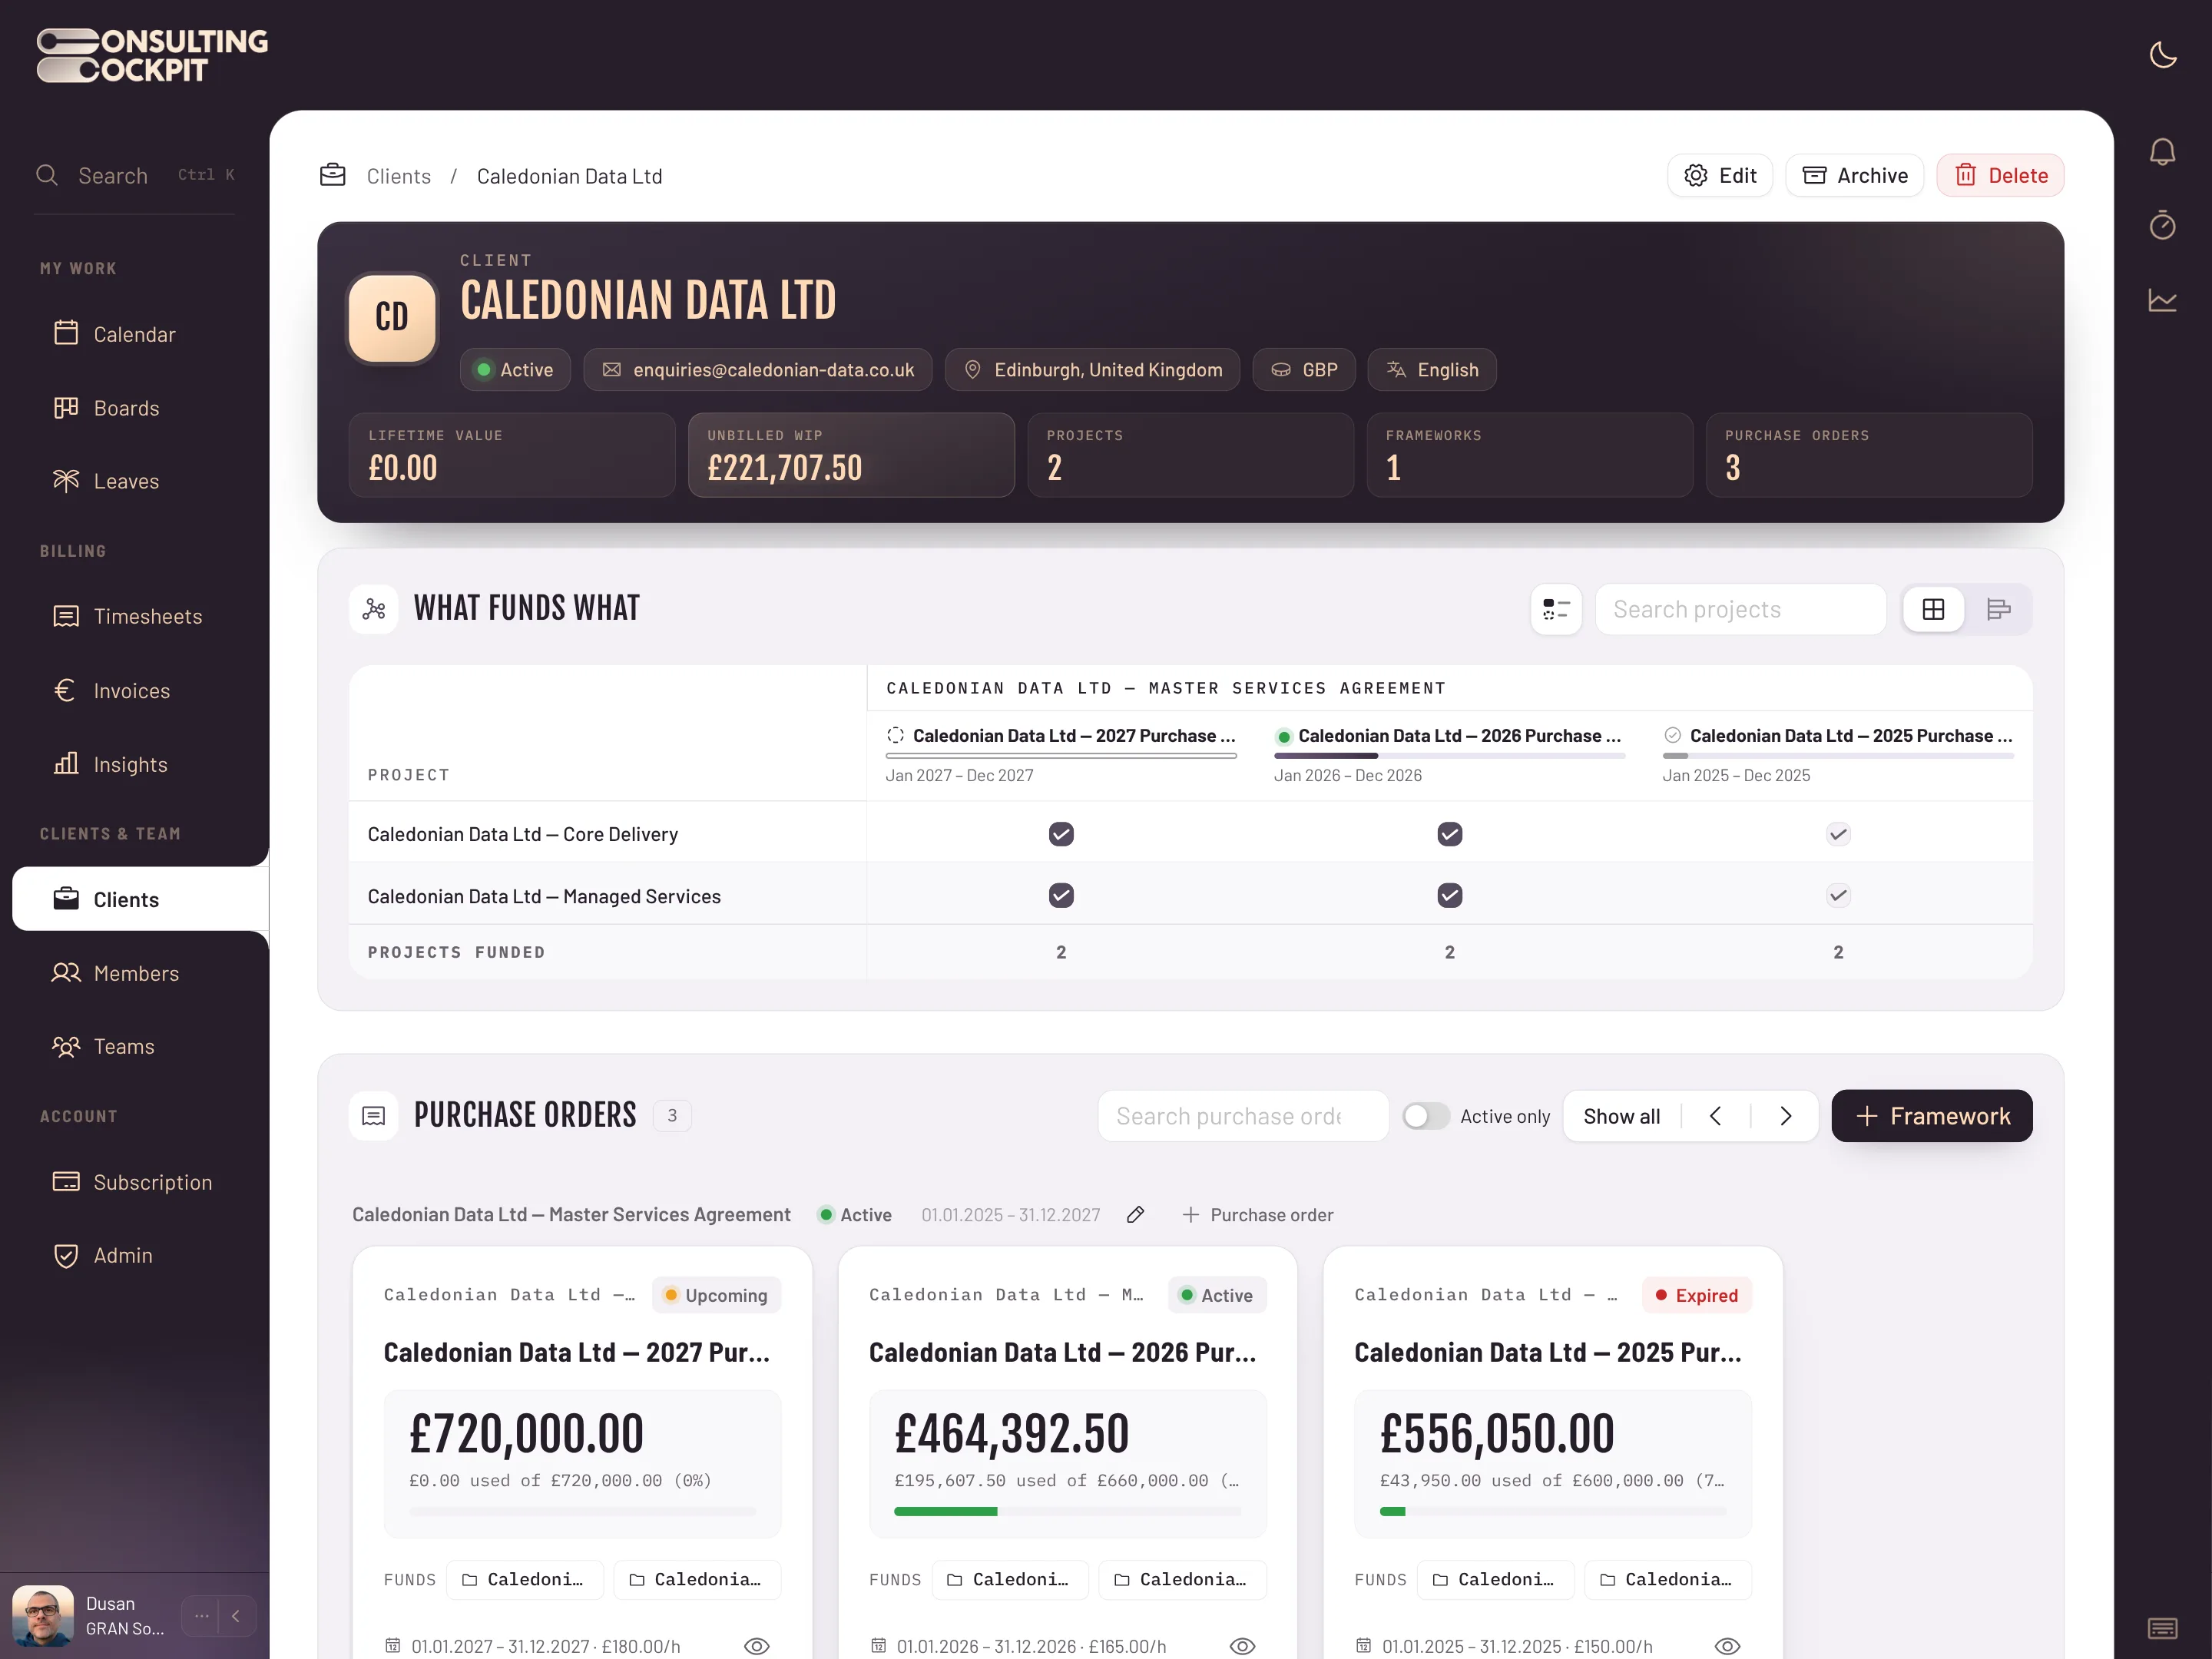
Real screens from the product — swipe or use the arrows.
Billable hours divided by available hours. Available hours account for an 8-hour day, weekends, local holidays and approved vacation.
No. Approved vacation is deducted from available hours before the rate is computed, so time off does not distort the number.
Yes. Prior-year and previous-month figures sit next to the current one, so both are visible at a glance.
No. Revenue and rate figures are for owners only.
Two figures count them per month: consultants below 70% and above 100%. Untracked days shows who has not logged time at all.
No. The figures are refreshed for you and you assemble your view from a catalogue of ready-made widgets.
Work out a consultant's utilization rate, billable revenue and the value of unbilled hours in a few seconds. Free, no sign-up.
Open the Billable Hours CalculatorSee billable and total utilization from available hours, and how many hours and euros separate a consultant from your target. Free, no sign-up.
Open the Utilization Rate CalculatorTrack time as usual and the first monthly figures arrive on the next refresh. Free for 30 days.